|
Modeling Brand Equity
William D. Neal, Senior Executive Officer Keith Crum, Sr. Statistical Consultant
The measurement and management of brand equity has become a major issue for marketers and marketing researchers over the last several years. The concept of brand equity goes well beyond the legal concept of a trademark or the accounting concept of goodwill. Brand equity encompasses a gestalt of intrinsic values, or equities, that adds to the tangible, measurable benefits delivered by a particular product or service. These intrinsic equities may include such things as the image imparted to the purchaser, advertising quality, advertising quantity, trust, long term reputation for reliability, customer support, social responsibility, and so forth.
As an example, two unbranded home breadmakers may deliver the exact same set of features in terms of capacity, warranty, ease of use, display, color alternatives, and price. As long as these two breadmakers remain unbranded, they will be undifferentiated and therefore equivalent to the purchaser. But, if we label one of those breadmakers, say, an Acme and the other Braun, most purchasers will attribute additional, intrinsic, value to the Braun product. The two branded breadmakers are no longer undifferentiated and, to most consumers, the Braun breadmaker has more value. Most purchasers associate the Braun brand name with the intrinsic values of quality, durability, reliability, trust, and an image with which they want to be associated.
In the marketplace, this concept of brand equity allows Braun to charge a price premium over Acme. That price differential allows Braun to reinforce their brand equity through improved product quality, higher levels of customer service, investments in socially responsible programs, and more effective promotion.
Consumers may also see a particular brand name as a contract. A brand's name may reduce consumers' sense of uncertainty, allowing them to purchase uncertainty reduction, or trust, thus improving their sense of value.
Promotion of a brand can address either price, tangible brand attributes or intrinsic brand attributes (equities). Brand equity is communicated using consistent visual cues and consistent messages, allowing the consumer to quickly and efficiently distinguish between brands and their intrinsic product attributes. As a purchaser considers the tangible product features in concert with brand equity (and price), they arrive at a set of products in a category which they will consider for purchase (i.e. their consideration set). Thus, a brand's equity is somewhat dependent on effective communications to the target market(s) and brand equity can often be improved to some extent with improved effectiveness of communications. However, communications alone cannot overcome a reputation for poor product quality, social irresponsibility, a lack of trust, and so on.
A brand's equity therefore becomes part of the tradeoff exercise a consumer considers as they first select their consideration set, then decide which product to purchase. That is, purchasers actively trade off both the perceived tangible benefits and the perceived intrinsic benefits delivered by products in their consideration set, against price, to arrive at their value hierarchy, and ultimately their purchase decision.
Brands that have high perceived value are always included in a purchaser's consideration set. If a brand's combined tangible and intrinsic equities are consistently higher than any other brand in the category, that brand will have the highest customer loyalty in terms of purchase, repurchase, and recommendation. Competing brands can only improve their loyalty against the brand equity leader by lowering price in the short term, improving their product's tangible features in the mid term, or improving their brand's intrinsic benefits, or equity, in the long term.
Measurement Issues
The challenge to both marketers and marketing researchers is determining how we measure and manage the intrinsic value of a brand (its equity) and how do we tie that value and our attempts to improve value to customer loyalty.
Recent literature addressing brand equity indicates that there are several different approaches to measurement. Brand equity can be addressed at either the corporate level or the category level and can also be addressed using internal data or external data. At the corporate level, brand equity can be assessed using internal financial data from the firm's accounting system, or it can be assessed using comparative financial performance data from similar firms (i.e. external). At the category level, a firm can address brand equity using unit profit margins in comparison to unit marketing costs, and in comparison to the costs of other products in the category. Alternatively, the firm can use consumer surveys to measure the perceived value of the product/brand compared to other products/brands in a category. These alternatives are shown in table 1.
Table 1.
|
Internal
|
External
|
Corporate Level
|
P & L Statements
Balance Sheets
|
Financial Comparatives
Industry Norms
|
Category Level
|
Unit margins
Unit profitability
|
Customer Surveys
|
In this paper we advocate using customer surveys at the category level to measure brand equity, then using that information to aggregate brand equities to the corporate level.
SDR's Brand Value Model
We believe the total value of a brand in a particular product/service category is composed of three parts. One part is due to the physical and readily identifiable (and replicatable) features of the brand that delivers specific, tangible benefits to the purchaser, thus impacting purchase choice. We call these the tangible product features. The second part is due to some perceived intrinsic value associated with the brand name due to such things as the image transferred to the purchaser, trust, longevity in the marketplace, social responsibility, consistent performance, and so forth (i.e. the intangibles), impacting purchase choice. We refer to this as the brand's image, or the brand's equity. The third component is the price of the product. Thus, the total value (or utility) of a product or service is a function of 1.) its physical, tangible, deliverable features, 2.) its brand equity, and 3.) its price. See figure 1.
In addition, we believe that a brand's value is directly related to customer loyalty. That is, if a particular brand maintains a significantly higher perception of value to a consumer than any other brand in the category, that consumer will consistently purchase that brand and consistently recommend that brand to others. Conversely, as brands in a category become less differentiated in terms of both tangible and intrinsic features, price becomes the major differentiator of value, and thus, there is little loyalty.
 SDR's Brand Value Model, shown in Figure 1, makes the following assumptions: SDR's Brand Value Model, shown in Figure 1, makes the following assumptions:
- The value someone attributes to a particular branded product or service is equivalent to the total utility (in the economic sense) that person assigns to the product or service. Brand value may vary from consumer to consumer.
- Brand value to a purchaser is the sum of the utilities of:
- Product Features - the bundle of tangible and readily identifiable product features/attributes delivered by the branded product or service.
- Brand Image - the bundle of intrinsic features/attributes delivered by the branded product or service.
- The price of those two bundles of features/attributes.
- Brand equity is defined as the bundle of intrinsic features/attributes delivered by a branded product or service. It is measured as the price differential someone is willing to pay for a particular branded product or service over an identical product or service that is unbranded. Alternatively, this definition can be re-crafted to state that brand equity is the difference in utility between two products or services that are perceived to deliver an identical set of tangible benefits at the same price.
- We use conjoint and discrete choice models to uncover brand equity. Thus, we make the normal assumptions in all conjoint/choice models that:
- Consumers are rational and attempt to optimize utility in the process of choosing a product or service.
- Utility is summative.
- Price has a negative utility. That is, the higher the price the lower the utility.
We observe that people tend to trade off price against the combined bundle of tangible product features and brand equity in order to optimize total utility or total value.
We also note that the intrinsic part of a brand's value, brand equity, may be positive or negative, meaning that a brand name can be used to increase overall utility of a choice, or may detract from the overall utility of a choice. Said differently, a positive brand equity allows a marketer to charge a premium in the market place over the value of the bundle of tangible features alone, or over the value of an unbranded product/service. And, some branded names in a particular category could have such a negative value among some purchasers such that the brand's equity could be below that of an unbranded, or base line, product/service.
SDR's Procedure for Modeling Brand Equity
We estimate the utilities of tangible product features, brand equity, and price on an individual level by subjecting each respondent in a market research study to two conjoint tasks. The first conjoint task uses all relevant brand names in the category and a set of possible prices for each brand. From this task we estimate total product utility (Ut) , price utility(Upr), and product utility (Up) for each brand and price level. In the first conjoint task, the brand name represents the sum of the utilities of both the tangible and intrinsic (intangible) features/attributes (Up + Ue).
It should be noted that one of the main reasons for this first conjoint task is to obtain an accurate estimate of the utility of price. When price is included in a conjoint task with other features, its utility tends to be understated, highly so in some cases. Also, a straight brand-price conjoint exercise allows us to derive the utilities of a relative large number of price points.
We next subject each respondent to a second conjoint task which includes tangible product features and levels of features that tend to drive purchase choice, price again (to offer a realistic trade off task) plus brand name. This is typically a fractional factorial, main-effects, full-profile design conjoint. However, Adaptive Conjoint Analysis (ACA) can also be used when the number of key features exceeds an efficient design for full profile conjoint models.
From this data we derive utility estimates for each of the individual, tangible, product features (ui's) and brand equity (Ue). For a given product attribute profile, the sum of the ui's describing that product equals the utility of the product's tangible features (Up). This second task also gives us an estimate of the utilities for brand names, Ue, after we have taken into account the tangible features and price.
We then allocate the utility of product from the first conjoint task into the appropriate product features and brand equity in the second conjoint. This allocation scheme is the proprietary part of the model. Figure 2. illustrates how the model works.
Figure 2
The estimate of brand equity is relative to the other brands in the study. Therefore, to obtain an estimate of absolute brand equity we often recommend that the study include either an unbranded product, a store brand, or a dummy brand name, whichever is most appropriate for the category. This provides the base price point for estimating brand equity in terms of its absolute dollar value.
This model then allows us to provide the following information.
- Obviously, we can estimate overall brand equity, Ue, for each brand and the average per unit price premium that equity is worth at the market level or within defined market segments compared to all the other brands in the study. Given accurate volume estimates, the per unit premium can be projected to a total value of the brand in a particular category.
- We can use the brand, price, and feature utilities to segment the sample into benefit groups such as price-sensitive, service sensitive, brand loyal for an individual brand, brand-combination loyal, and attribute importance groups and calculate brand value and brand equities for each segment. This assumes there is sufficient sample size to make the segmentation reliable.
- We can conduct simulations to estimate share of preference, given each brand equity coupled with a known or contemplated tangible product feature profile and a particular price. Thus, we can observe the effects on share of preference for price changes and changes in tangible attribute levels for any brand or brand combination. A series of simulations whereby we only vary price allows us to develop estimates of price elasticity and cross elasticities for a brand or brands at the total market level or within any market segment.
- In a similar fashion, this methodology can be used to test and evaluate the extension of a known brand name into a new product/service category and to evaluate the equity transfer of the brand name into the new category.
- Longitudinally, we can observe the effects on brand equity and share of preference due to changes in the marketing mix for any brand or combination of brands.
- Given self-explicated ratings of brands on the more intrinsic features of a brand (e.g., a brand that enhances my self-image, quality of advertising, contribution to the community, social responsibility, protecting the environment, etc.), we often are able to relate brand equity to particular activities of the firm using regression techniques.
EXAMPLE
Following is a simplified example of how the model works. We use the home breadmaker product category mentioned previously. The first conjoint uses only brand and price attributes as shown in Table 2. Each brand is allowed to be associated with each price.
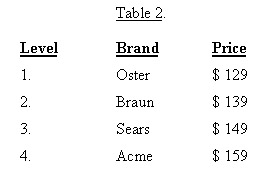
In this first conjoint exercise, each respondent ranks (or rates) the brand-price combinations in terms of preference.
The analysis of this data yields a set of derived utilities, or values, for each brand and each price, plus a derived overall importance of brand and price for each respondent. For example, one respondent's utilities and importances may look like those shown in table 3.
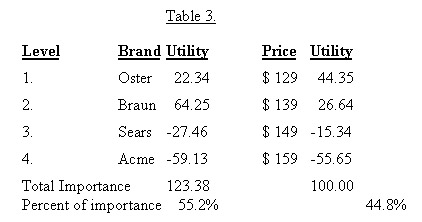 If current market prices were as shown in table 4, this respondent's value for each brand/price configuration would be as shown in the column labeled "Utility", which is simply the sum of the respondent's utility for the brand and the current price. If current market prices were as shown in table 4, this respondent's value for each brand/price configuration would be as shown in the column labeled "Utility", which is simply the sum of the respondent's utility for the brand and the current price.
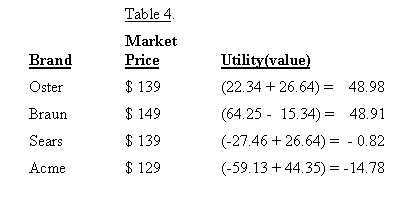 Since this respondent places the highest utility on the Oster breadmaker at $139, they would prefer that brand/price combination over all those others available. Since this respondent places the highest utility on the Oster breadmaker at $139, they would prefer that brand/price combination over all those others available.
At this point, brand name is the sum of both tangible and intrinsic attributes. The second conjoint is designed to let us separate those out.
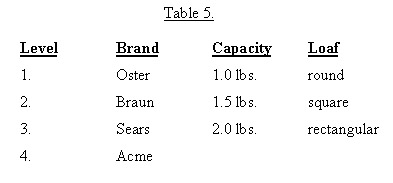
The second conjoint includes the tangible product features that drive choice. For simplicity, we have only chosen two, capacity and loaf configuration, as shown in Table 5.
 In this second conjoint exercise, each respondent ranks (or rates) brand-feature combinations in terms of preference. We do not need to show the respondent all possible 36 combinations because we can use fractional factorial designs. In this second conjoint exercise, each respondent ranks (or rates) brand-feature combinations in terms of preference. We do not need to show the respondent all possible 36 combinations because we can use fractional factorial designs.
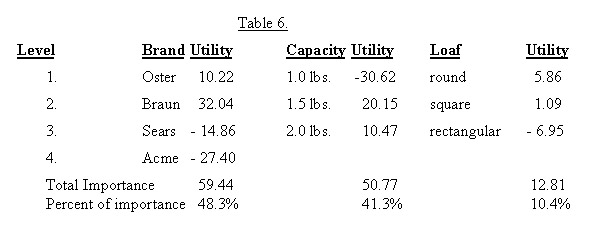
The analysis of this data yields a set of derived utilities, or values, for each brand and each feature, plus a derived overall importance of brand, capacity, and loaf configuration for each respondent. For example, our respondent's utilities and importances may look like this:
 These utilities are then re-scaled, using a proprietary algorithm, so that their importance's, which are based on the differences in utility, take into account the importance of brand in the first conjoint exercise. Combining price from the first conjoint exercise with brand and features from the second conjoint exercise, we get the following model for this respondent. These utilities are then re-scaled, using a proprietary algorithm, so that their importance's, which are based on the differences in utility, take into account the importance of brand in the first conjoint exercise. Combining price from the first conjoint exercise with brand and features from the second conjoint exercise, we get the following model for this respondent.
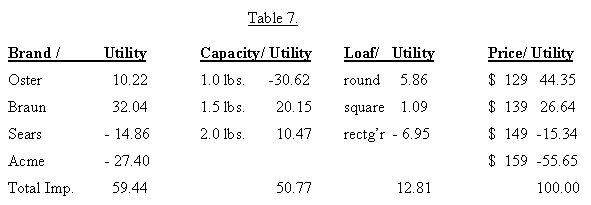 Here, the importances of brand, capacity, and loaf are adjusted to be comparable with total importance of brand from the first conjoint exercise. We see that Braun has the highest brand equity, followed by Oster. Also, this respondent has a high preference for a 1.5 lb. capacity and is fairly ambivalent about loaf configuration. Also note that this respondent is very price sensitive, especially for any price above $139. Here, the importances of brand, capacity, and loaf are adjusted to be comparable with total importance of brand from the first conjoint exercise. We see that Braun has the highest brand equity, followed by Oster. Also, this respondent has a high preference for a 1.5 lb. capacity and is fairly ambivalent about loaf configuration. Also note that this respondent is very price sensitive, especially for any price above $139.
The remaining task is to use this data to determine the brands' values in dollars.
We will assume that the Acme brand is our baseline. The question we wish to answer is this: At what price for a Braun is this respondent indifferent between an Acme breadmaker and a Braun breadmaker, all else being the same?
We know that an Acme breadmaker with a 1.5 lb. capacity, and a round loaf configuration, priced at $129 has a total utility of (-27.40 + 20.15 + 5.86 + 44.35 =) 42.96. At what price will the Braun have the same utility? A few calculations permit us to determine the price differential between the two brands with exactly the same features.
Similar calculations for Oster and Sears yields the following table:
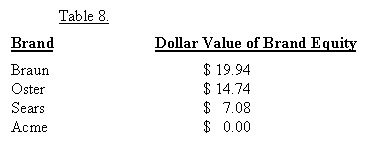 Obviously, we can make these calculations for every respondent in the survey and report averages for total market or any market segment. If the sample is projectable to the total market, then we can easily estimate the total value of a brand name by multiplying the average brand equity by total unit sales. Obviously, we can make these calculations for every respondent in the survey and report averages for total market or any market segment. If the sample is projectable to the total market, then we can easily estimate the total value of a brand name by multiplying the average brand equity by total unit sales.
In addition, the calculated utilities and importances from table 7 can be used as a basis for segmenting the market into such groups as "price sensitive", "feature sensitive", "brand loyal", and so forth. Then we can calculate brand equities in each segment and optimize a brand's pricing scheme across segments.
We build a market simulator to estimate share of preference for each brand name with a known or contemplated attribute profile and a particular price. Thus, we can observe the effects on share of preference for price changes and changes in features for any brand or brand combination or, for the introduction of a branded product extension. A series of simulations whereby we only vary price, holding features constant, allows us to develop estimates of price sensitivity for any brand at the total market or any market segment.
It should be obvious that this modeling approach can also be used to determine how much of a brand's equity can be initially transferred into another product or service category.
Finally, we can monitor a brand's equity over time through a series of market studies. The results of experimentation with the marketing mix can be easily monitored in this manner.
Although we have used a very simple illustration of SDR's Brand Value Model, these models can be designed and used in just about any product or service category. However, the designs can get very complex.
The advantages of the modeling approach described in this paper, using external surveys are:
- The model is not dependent on internal financial data.
- It is relatively fast and easy to execute using proven research methods.
- It can be executed at any time in the business cycle. That is, it is not dependent on internal cyclical accounting changes.
- It takes into account all major relevant brands in a defined product/service category.
- It measures brand equity relative to other current and potential brands in the category, including unbranded items when they exist in the category.
- It can be used to measure the transfer of a brand's equity into another category.
- It recognizes that value of any one brand's equity can be defeated in the marketplace by competitor pricing strategies, at least in the short run.
- It allows calculation of total brand value and brand equity over alternative pricing scenarios and volume scenarios for total market, or within defined subsegments.
- It allows the firm to assess price elasticity and cross elasticities of their own brands and competitor brands in a category.
- Results can be projected to estimate the total value of a brand name under alternative sales projections. Thus, this modeling approach can be used to evaluate the total dollar value of a brand name for purposes of evaluation and acquisition.
- If self-explicated ratings of the components of brand equity are acquired from the same respondents, brand equity can be further decomposed into specific equity-building activities.
Caveats and Cautions:
- As in all conjoint models, the attribute set must include those features that are relevant to the purchase decision for all major market segments. If a major decision-driving attribute is excluded, it will be confounded with the estimate of brand equity.
- This model works well for both products and well-defined services. However, it does not work well across categories (i.e. for a brand family). That is, the equity of a brand family (e.g. Honda automobiles, motorcycles, generators, outboard motors, etc.) is very difficult to measure simultaneously. Each category needs to be addressed separately. Also, the narrower the product category is defined, the more accurate the estimates.
- If the category is highly price sensitive, or is defined rather widely, it is usually appropriate to include a price attribute in the second conjoint in order to accurately derive the utilities of the tangible features and to keep preference judgments realistic.
- We have used discrete choice models to estimate brand equity in a similar manner. Since these models do not allow us to measure utility at the individual respondent level, it is not possible to use model results to segment the market in terms of benefits being sought.
- Brand names are usually limited to nine levels when using orthogonal designs. However, we have had considerable success with more than nine by using non-orthogonal designs.
|